One of the most common questions we get from our skilled nursing facility clients is, “How does my facility’s bad debt expense as a percentage of revenue compare to industry averages?”
When we publish our annual Benchmark Report for Skilled Nursing Facilities in Maryland, we gather statistics concerning accounts receivable and bad debt. A deep analysis of data from more than 200 Maryland skilled nursing facilities reveals the bad debt expense as a percentage of revenue as a statewide average, as well as by region.
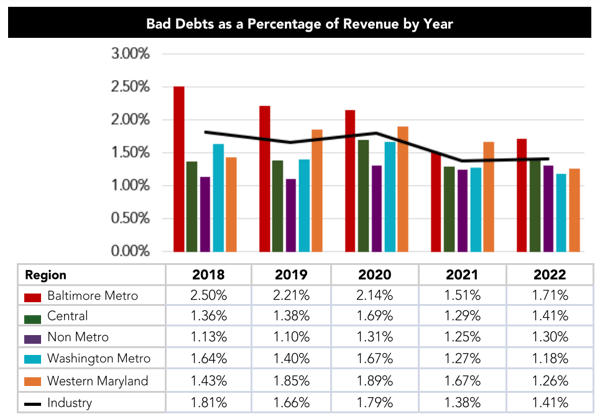
The five-year period above, as an example, shows industry averages for bad debt expense as a percentage of revenue.
The far-right column (2022) indicates that the industry bad debt expense as a percentage of revenue was 1.41%, equating to lost cash of approximately $1,400 for every $100,000 of revenue earned.
The Baltimore Metro region’s bad debt percentage exceeds the industry average, while the Central region is right at the industry average. The remaining regions, Non Metro, Washington Metro and Western Maryland, fall below the statewide average when it comes to bad debt expense as a percentage of revenue.
There are all sorts of reasons why one skilled nursing facility’s percentage might differ from that of another facility, even one that’s right down the road. After all, it’s up to the individual facility’s management to determine what and how much gets written off. In other words, collection philosophies vary.
Let’s take a look at what it might mean if your rate is above or below the industry average. This all assumes, of course, that you are properly recording your facility’s projected bad debt expense in the first place.
If your bad debt percentage is above industry averages:
- You might be managing receivables ineffectively.
- You might not be adequately vetting potential new residents for “collectability.”
- You might be more worried about the short term benefits of just filling beds, without enough thought about the long term concern of collecting receivables. (Being too optimistic about the ability to resolve potential or known Medicaid eligibility issues.)
If your bad debt percentage is lower than industry averages:
- You might have a low turnover rate with residents. (Minimal or no new Medicaid pending residents.)
- You are most likely doing a good job staying on top of receivables.
For Help
Contact us online or call 800.899.4623.23 to discuss your skilled nursing facility and ways to better manage your receivables.
This article was originally published in June 2016 and was updated in April 2024.


