There were several big financial and occupancy changes in Maryland’s skilled nursing industry due to COVID-19. This is especially evident in areas like occupancy percentages, overall costs per patient day and nursing costs. In this article, we’ll discuss why these three areas changed in 2020 and what the data looks like compared to prior years.
Occupancy Percentages Plummeted
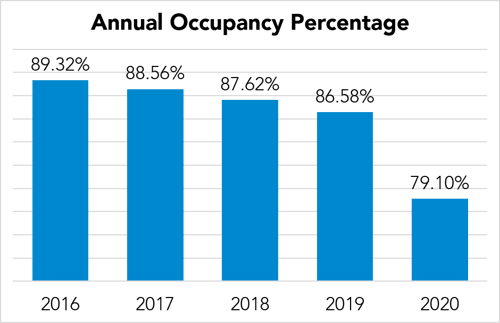
Over the past few years, we have seen a continual decrease in median occupancy percentage at skilled nursing facilities across Maryland. Several factors have played into this steady decline, including more alternative options for senior care, like assisted living, home care and, more recently, the use of telemedicine. While these options and others still exist, there is no doubt that the biggest contributor to decline in occupancy percentage in 2020 was the pandemic.
The largest cause of loss of occupancy in 2020 was due to COVID-19 related deaths. In addition, at the beginning of the pandemic, facilities were not always able to accept new residents, especially if the facility already had active COVID-19 cases. Another major hit to occupancy levels came from the loss of traditional Medicare short stays related to rehabilitation. During the early stages of the pandemic, surgery centers closed, with elective procedures delayed and individuals postponing procedures.
With more people at home due to unemployment and telework during the early days of the pandemic, families had more capacity to care for their loved ones at home. Many facilities saw decreases in occupancy due to people taking loved ones out of facilities out of fear of residents contracting COVID-19 as well as the inability to visit residents during lockdowns.
The overall industry occupancy percentage between 2019 and 2020 decreased 7.48%. This is a result of total comprehensive days for all facilities decreasing from 8,228,422 total days to 7,677,660, a decrease of 550,762 days or 1,505 residents. This is the highest decrease in the number of residents since we started tracking the data in 2009. Before 2020, the highest recorded decrease in the number of residents was 791 residents in 2012.
Total Cost Per Patient Day Increased
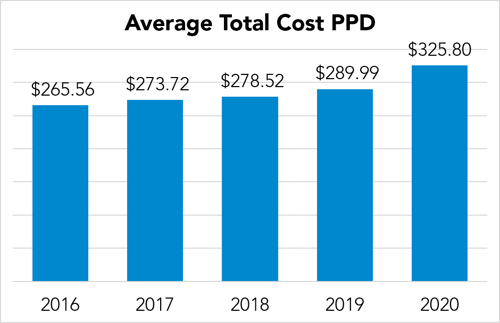
The cost to care for residents continues to increase across the state in each region. The industry has seen an unprecedented increase in total cost per patient day, primarily due to the pandemic. One new cost incurred by all facilities was the cost for state-required testing of residents and staff for COVID-19. While the state initially covered the cost of testing, in August 2020, facilities were required to absorb the cost.
Another significant cost that contributed to the large increase in total cost per patient day was Personal Protective Equipment (PPE). Even with handmade and donated PPE, most facilities had to purchase medical grade supplies to protect staff and residents. Other pandemic-related costs included hazard pay, increased cost of agency nursing, cleaning supplies, protective shielding and capital improvements related to COVID isolation rooms as well as HVAC upgrades.
While all of these things played a significant impact on the total cost to care for a resident per day in 2020, these aren’t the only reasons costs increased so significantly in 2020. Since 2009, the industry average for total cost PPD has increased $100.81. In 2020, the industry average total cost PPD increased $35.81, which is the highest increase the industry has seen since we started tracking the data in 2009.
Nursing Costs Continue to Rise
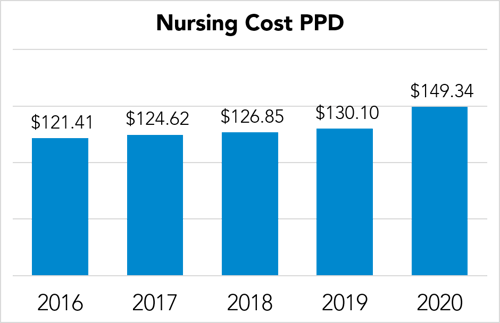
Nursing has traditionally been the largest cost center for all facilities. Overall nursing costs have increased from $121.41 PPD in 2016 to $149.34 PPD in 2020. This equates to a $27.93 increase per patient day since 2016. The total increase for 2020 alone was $19.24 PPD (68.89% of the increase seen since 2016).
The increases in 2020 are due to the pandemic, with several different factors leading to this significant increase in nursing costs PPD. One such factor is the increase in overall nursing salaries. Many facilities paid either hazard pay or bonuses to employees who worked during the various stages of the pandemic. These and other facilities may have experienced increases in agency nursing costs as a result of nursing staff who were not able to return to work due to childcare needs or illness due to the pandemic. Many nursing agencies also increased the hourly rate due to the pandemic. Another major factor that resulted in 2020 nursing costs was the cost for PPE.
Want More Data Like This?
Our annual benchmark report for skilled nursing facilities in Maryland includes a breakdown of data in multiple cost areas, broken down by industry, region, and facility size and type.