
Why doesn’t your banking dashboard show your daily calorie count? Sure, you might like to know how many calories you’ve consumed so far, but that’s better suited for your health and fitness apps rather than your online bank account’s home screen.
The same principles apply to your business intelligence dashboard. We are constantly distracted by incoming emails, new information from various departments, and perhaps your chatty officemate. Your business intelligence dashboard should be a distraction-free interface that focuses only on the information that’s relevant to you.
Using tools like Sage Enterprise Intelligence, you can set up specific key performance indicators (KPIs) to appear on your dashboard, which will help you with your day-to-day tasks.
Before we dig into the details, let’s do a quick debrief on what business intelligence really is. Business intelligence visualization is a software solution that reads data from multiple sources to show role-specific metrics on a neat and tidy dashboard.
What Is Business Intelligence?
Business intelligence visualization is a software solution that reads data from multiple sources to show role-specific metrics on a neat and tidy dashboard.
Here are a few reasons why organizations use business intelligence visualization:
- It real-time interfaces data from multiple sources into one cohesive dashboard.
- It’s mobile friendly for users outside of the office.
- The information on the dashboard is secure and customizable to every user.
- Everyone, from sales to accounts payable, can benefit from it.
Looking for a deeper dive into business intelligence? You can get more details in this blog post.
How to Build the Right Dashboard
Business intelligence software pulls information from several different sources. While this is great news, it can also be overwhelming to choose the right information to include in your dashboard.
The key to building the right dashboard is to focus on the key performance indicators that are meaningful to you, given your role in your business.
For instance, purchasing managers might want to keep tabs on PO cycle times, supplier defect rates, and average lead times. However, sales representatives want to know the number of accounts by type, open opportunities by qualifying stage, monthly sales numbers, and top-selling products. Even though these two staff members are using the same business intelligence software, the information they need from their software is very different. Luckily, software like Sage Enterprise Intelligence has several prebuilt dashboards to make things easy.
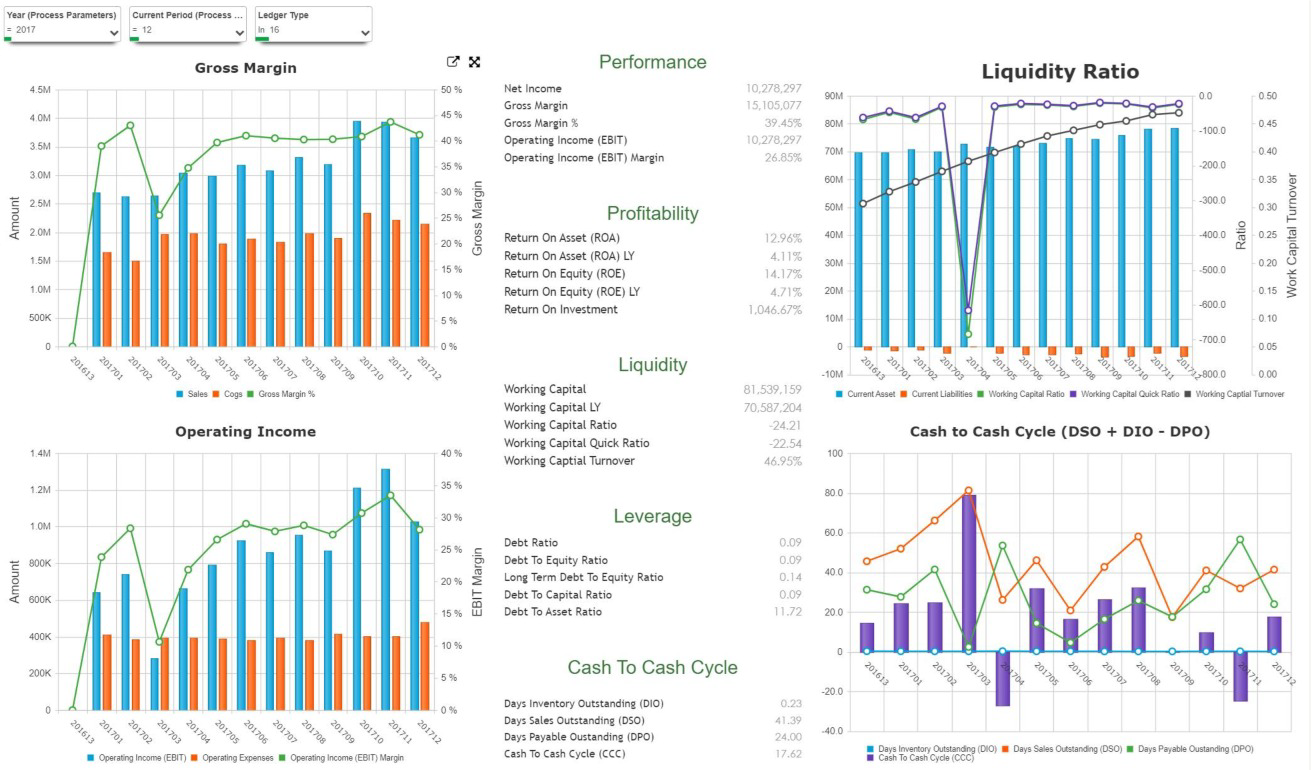
Here’s a general dashboard in Sage Enterprise Intelligence:
Which KPIs Do Financial Professionals Need?
Financial professionals have a slew of KPIs they may be tempted to add to their dashboard. There are several important data points you may want instant reporting on, but it’s best to focus only on what’s most important.
If you look at the image below, you will see several KPIs showing the gross profit margin, the operating profit margin, and the net profit margin. There are also two graphs showing the operating expenses and the operating income over the last several months. The bar graphs show the operating income and expenses, while the line graphs show the percentages.
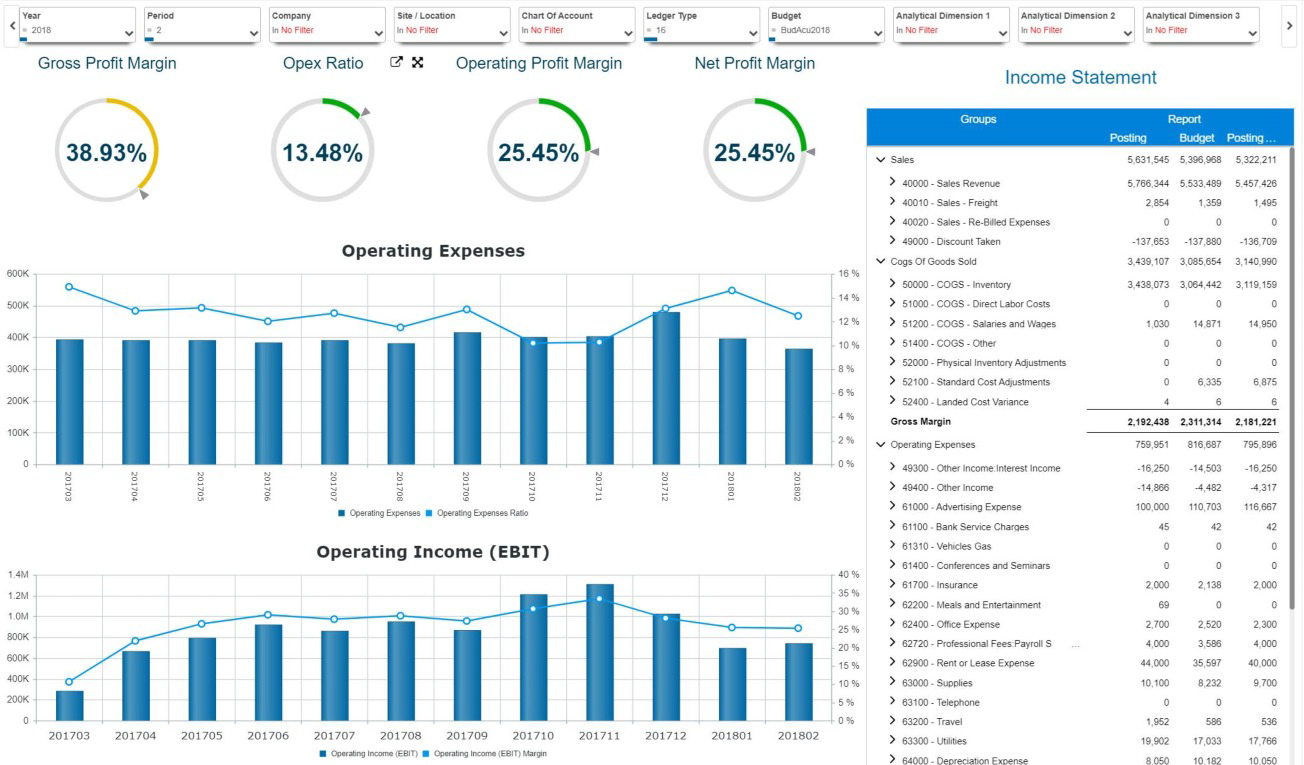
(Sage Enterprise Intelligence sample dashboard)
As ERP consultants, we see a lot of different dashboards set up. These are some of the most popular financial KPIs you may want to add into your dashboard:
- Accounts payable turnover – shows investors how many times per period the company pays its average payable amount.
- Accounts receivable turnover – shows the number of times per year that a business collects its average accounts receivable.
- Average collection period – measures the effectiveness of a company’s ability to collect payments from its credit customers.
- Debt ratio (debt to asset ratio) – assesses company leverage by measuring what proportion of company assets are financed by debt.
- Net profit margin – shows how much of each dollar collected by a company as revenue translates into profit.
- Gross margin – represents the percent of total sales revenue that the company retains after incurring the direct costs associated with producing the goods and services it sells.
- Working capital ratio – shows the ability of a business to pay for its current liabilities with its current assets.
The Truth Is, We Can’t Tell You What the Perfect Dashboard Looks Like
Many people are surprised to hear this, but there is no set formula to creating the ideal dashboard. The beauty of business intelligence is that it’s fully customizable to each user. The metrics that are most important to your coworker or even another person in your department are not necessarily what’s important to you.
When you start creating your business intelligence dashboard, it’s easy to tack on several different metrics that you use from time to time just because you can. The best way to build the right dashboard is to take a close look at a handful of KPIs you actively monitor and decide which ones belong front-and-center in your dashboard view.
Need Help?
Did you know that your business intelligence solution can pull information from all your data sources, like your ERP system, your Amazon store or your other integrated software solutions? Contact us here or call us at 410.685.5512 if you need help optimizing your business intelligence solution for your business.
